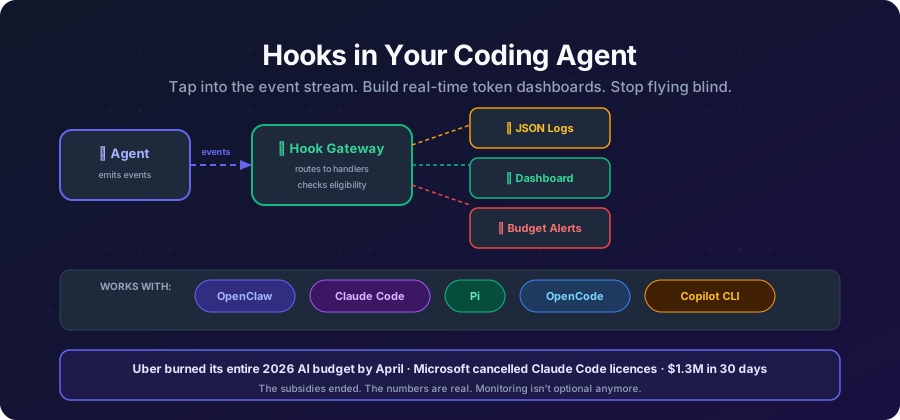
You fire up a coding agent, start a long refactoring session, and two hours later you’ve burned through $40 of API credits. There was no dashboard. No alert. No “hey, you’re spending fast” tap on the shoulder. Just a bill.
Sound familiar?
Most coding agents treat token usage as an afterthought — something you check after the damage is done. A /status here, a /usage there. But these are passive. They don’t monitor. They don’t alert. They don’t pipe data into your observability stack.
Hooks change that. And the good news: most modern coding agents now support them. The bad news: each one does it differently.
This post walks through how to monitor token usage with hooks in five popular agents — OpenClaw, Claude Code, Pi, OpenCode, and GitHub Copilot CLI — with working code for each.
Why Hooks Matter for Token Monitoring
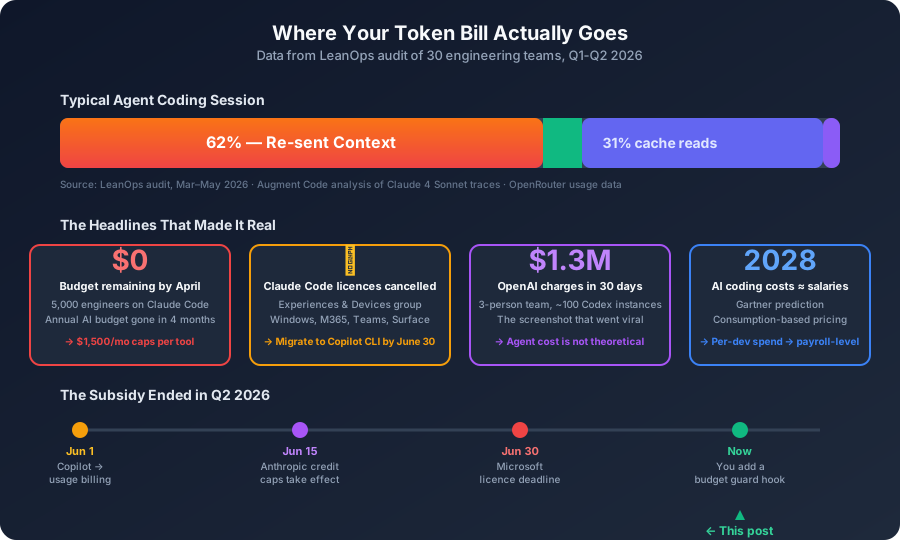
Before we dive into implementations, let’s be clear about what hooks give you that /status doesn’t:
- Real-time alerts — get notified the moment you hit a budget threshold, not after
- Structured logging — pipe JSON lines to Grafana, Datadog, or your favorite observability tool
- Cost attribution — tag every model call with a project or team
- Audit trails — log every tool call, every model response, every session change
- Policy enforcement — some agents let you block runs that exceed limits
Now let’s see how each agent exposes this.
OpenClaw
OpenClaw has the most mature hook system of the four. It supports two kinds:
- Internal hooks: small scripts that run inside the Gateway when agent events fire
- Plugin hooks: in-process extension points with richer context and decision capabilities (block, cancel, override)
Anatomy of a Hook
A hook is a directory with two files:
token-monitor/
├── HOOK.md          # Metadata + documentation
└── handler.ts       # Handler implementation
HOOK.md — the manifest:
---
name: token-monitor
description: "Tracks token usage per model and alerts on budget thresholds"
metadata:
  openclaw:
    emoji: "📊"
    events: ["model_call_ended", "agent_end"]
    requires:
      bins: ["node"]
---

# Token Monitor

Logs token usage after each model call and session end.
handler.ts — the logic:
const handler = async (event) => {
  if (event.type === "model_call_ended") {
    const { provider, model, durationMs, outcome, contextTokenBudget } =
      event.context;

    console.log(
      JSON.stringify({
        timestamp: event.timestamp,
        session: event.sessionKey,
        provider,
        model,
        durationMs,
        outcome,
        contextTokenBudget,
      })
    );
  }

  if (event.type === "agent_end") {
    console.log(
      JSON.stringify({
        timestamp: event.timestamp,
        session: event.sessionKey,
        event: "session_end",
      })
    );
  }
};

export default handler;
Every event includes type, action, sessionKey, timestamp, messages, and a context object with event-specific data.
Key Events for Token Monitoring
| Event | Key context fields |
|---|---|
model_call_started |
provider, model, callId, runId, contextTokenBudget |
model_call_ended |
All of the above + durationMs, outcome, upstreamRequestIdHash |
agent_end |
Final messages, success state, run duration |
reply_payload_sending |
usageState (best-effort per-turn snapshot with token counts), sessionKey, runId |
The reply_payload_sending event is particularly useful — it can include usageState, a best-effort live per-turn model/usage/context snapshot with actual token counts and cost estimates.
Working Token Budget Monitor
import Database from "better-sqlite3";
import { mkdirSync } from "fs";
import { join } from "path";
import { homedir } from "os";

const BUDGET_WARN = Number(process.env.TOKEN_BUDGET_WARN_MB || 5) * 1_000_000;
const BUDGET_HARD = Number(process.env.TOKEN_BUDGET_HARD_MB || 10) * 1_000_000;
const DATA_DIR = join(homedir(), ".openclaw", "data");
const DB_PATH = process.env.TOKEN_DB_PATH || join(DATA_DIR, "token-usage.db");

// Persistent SQLite storage — survives gateway restarts
mkdirSync(DATA_DIR, { recursive: true });
const db = new Database(DB_PATH);

db.exec(`
  CREATE TABLE IF NOT EXISTS model_calls (
    id INTEGER PRIMARY KEY AUTOINCREMENT,
    ts TEXT NOT NULL,
    session TEXT NOT NULL,
    provider TEXT,
    model TEXT,
    duration_ms INTEGER,
    outcome TEXT,
    context_token_budget INTEGER
  );
  CREATE TABLE IF NOT EXISTS sessions (
    session TEXT PRIMARY KEY,
    started_at TEXT,
    ended_at TEXT,
    total_calls INTEGER DEFAULT 0
  );
  CREATE INDEX IF NOT EXISTS idx_calls_session ON model_calls(session);
  CREATE INDEX IF NOT EXISTS idx_calls_ts ON model_calls(ts);
`);

const insertCall = db.prepare(`
  INSERT INTO model_calls (ts, session, provider, model, duration_ms, outcome, context_token_budget)
  VALUES (?, ?, ?, ?, ?, ?, ?)
`);

const upsertSession = db.prepare(`
  INSERT INTO sessions (session, started_at, total_calls) VALUES (?, ?, 1)
    ON CONFLICT(session) DO UPDATE SET total_calls = total_calls + 1
`);

const endSession = db.prepare(`
  UPDATE sessions SET ended_at = ? WHERE session = ?
`);

const getSession = db.prepare(`
  SELECT total_calls FROM sessions WHERE session = ?
`);

function formatTokens(n) {
  if (n >= 1_000_000) return `${(n / 1_000_000).toFixed(1)}M`;
  if (n >= 1_000) return `${(n / 1_000).toFixed(1)}K`;
  return `${n}`;
}

const handler = async (event) => {
  const { sessionKey } = event;

  if (event.type === "model_call_ended") {
    const { provider, model, durationMs, outcome, contextTokenBudget } =
      event.context;

    insertCall.run(
      event.timestamp, sessionKey, provider, model,
      durationMs, outcome, contextTokenBudget
    );
    upsertSession.run(sessionKey, event.timestamp);

    const row = getSession.get(sessionKey);
    if (contextTokenBudget && row.total_calls > BUDGET_HARD) {
      event.messages.push(
        `🚨 HARD LIMIT: Session has exceeded ${formatTokens(BUDGET_HARD)} tokens in context budget usage.`
      );
    } else if (contextTokenBudget && row.total_calls > BUDGET_WARN) {
      event.messages.push(
        `⚠️ Warning: Session approaching token budget limit (${formatTokens(row.total_calls)} / ${formatTokens(BUDGET_HARD)}).`
      );
    }
  }

  if (event.type === "agent_end") {
    endSession.run(event.timestamp, sessionKey);
  }
};

export default handler;
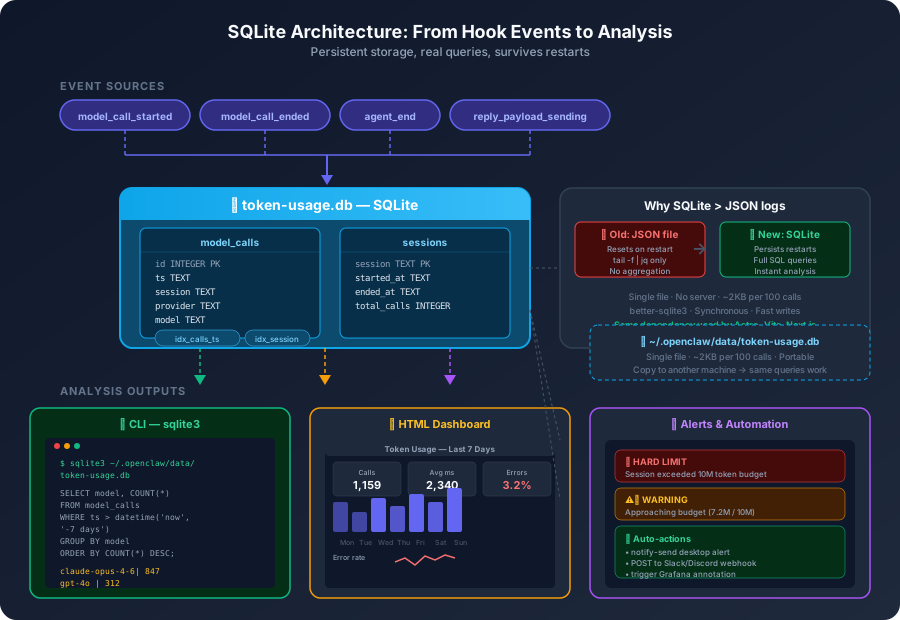
Why SQLite instead of JSON logs?
Two reasons:
-
It survives restarts. The original version used an in-memory
Mapthat wiped every time the gateway restarted. You’d lose all session tracking mid-day. SQLite persists. -
You can query it. Instead of
tail -f | jqon a growing text file, you get actual SQL:
# Top 5 most expensive sessions this week
sqlite3 ~/.openclaw/data/token-usage.db "
  SELECT session, total_calls, started_at
  FROM sessions
  WHERE started_at > datetime('now', '-7 days')
  ORDER BY total_calls DESC
  LIMIT 5;
"

# Calls per model, last 30 days
sqlite3 ~/.openclaw/data/token-usage.db "
  SELECT model, COUNT(*) as calls,
         ROUND(AVG(duration_ms)) as avg_ms,
         ROUND(SUM(duration_ms) / 1000.0) as total_seconds
  FROM model_calls
  WHERE ts > datetime('now', '-30 days')
  GROUP BY model
  ORDER BY calls DESC;
"

# Error rate by provider
sqlite3 ~/.openclaw/data/token-usage.db "
  SELECT provider,
         COUNT(*) as total,
         SUM(CASE WHEN outcome != 'success' THEN 1 ELSE 0 END) as errors,
         ROUND(100.0 * SUM(CASE WHEN outcome != 'success' THEN 1 ELSE 0 END) / COUNT(*), 1) as error_pct
  FROM model_calls
  WHERE ts > datetime('now', '-7 days')
  GROUP BY provider;
"

# Daily call volume trend
sqlite3 ~/.openclaw/data/token-usage.db "
  SELECT DATE(ts) as day, COUNT(*) as calls,
         ROUND(SUM(duration_ms) / 1000.0) as seconds
  FROM model_calls
  WHERE ts > datetime('now', '-30 days')
  GROUP BY DATE(ts)
  ORDER BY day;
"
That’s the real win. JSON logs are fine for piping into Datadog. But for answering “which model am I spending the most time on?” or “what’s my error rate?” — SQL beats grep every time.
Installation
# Enable hooks
openclaw hooks enable

# Place your hook
mkdir -p ~/.openclaw/hooks/token-budget-guard
# Copy HOOK.md and handler.js into the directory

# Verify
openclaw hooks list
Or configure in your gateway config:
{
  "hooks": {
    "internal": {
      "enabled": true,
      "entries": {
        "token-budget-guard": {
          "enabled": true,
          "env": {
            "TOKEN_BUDGET_WARN_MB": "3",
            "TOKEN_BUDGET_HARD_MB": "8"
          }
        }
      }
    }
  }
}
Pi
Pi takes a different approach. Instead of standalone hook scripts, it uses TypeScript extensions that subscribe to lifecycle events via pi.on(). These extensions have access to Pi’s full ExtensionAPI, giving them richer context than shell-level hooks.
Extension Anatomy
A Pi extension is a TypeScript module with a default export function:
import type { ExtensionAPI } from "@mariozechner/pi-coding-agent";

export default function (pi: ExtensionAPI) {
  pi.on("session_start", async (event, ctx) => {
    console.log("Session started");
  });
}
Key Lifecycle Hooks for Token Monitoring
| Hook | When it fires | Useful for |
|---|---|---|
session_start |
On initial session load | Initialize tracking |
session_before_switch |
Before switching sessions | Log session transitions |
model_call_started |
Before a provider API call | Track model, provider, timing |
model_call_ended |
After provider responds | Track duration, outcome, token data |
tool_call_started / tool_call_ended |
Before/after tool execution | Correlate tool usage with cost |
session_end |
When session completes | Emit final summary |
Working Token Monitor Extension
import type { ExtensionAPI } from "@mariozechner/pi-coding-agent";

const sessions = new Map();

export default function (pi: ExtensionAPI) {
  pi.on("session_start", async (event, ctx) => {
    sessions.set(event.sessionId, {
      startedAt: Date.now(),
      modelCalls: 0,
      totalDurationMs: 0,
    });
  });

  pi.on("model_call_ended", async (event, ctx) => {
    const session = sessions.get(event.sessionId);
    if (!session) return;

    session.modelCalls += 1;
    session.totalDurationMs += event.durationMs || 0;

    console.log(
      JSON.stringify({
        agent: "pi",
        sessionId: event.sessionId,
        provider: event.provider,
        model: event.model,
        durationMs: event.durationMs,
        outcome: event.outcome,
        cumulativeCalls: session.modelCalls,
        cumulativeDurationMs: session.totalDurationMs,
      })
    );
  });

  pi.on("session_end", async (event, ctx) => {
    const session = sessions.get(event.sessionId);
    if (session) {
      console.log(
        JSON.stringify({
          agent: "pi",
          sessionId: event.sessionId,
          event: "session_end",
          totalCalls: session.modelCalls,
          totalDurationMs: session.totalDurationMs,
          durationSeconds: (Date.now() - session.startedAt) / 1000,
        })
      );
      sessions.delete(event.sessionId);
    }
  });
}
Installation
# Save as token-monitor.ts in your extensions directory
# or load it:
pi --extension ./token-monitor.ts

# Or add to pi config:
# extensions:
#   - path: ./token-monitor.ts
Pi’s advantage: Extensions run in-process with access to Pi’s full API, so you can also register custom tools, commands, and modify prompts — all from the same extension. The Weave integration for tracing Pi sessions is built this way.
Pi’s limitation: Extensions are TypeScript-only (no shell scripts), and you need Pi’s SDK as a dependency. But for monitoring, the richer event context makes up for it.
OpenCode
OpenCode uses a plugin system with two kinds of hooks: transform hooks (modify data in-flight) and runtime hooks (observe and react to lifecycle events). For token monitoring, runtime hooks are what you want.
Plugin Anatomy
An OpenCode plugin is a JavaScript/TypeScript module exporting a setup function:
// token-monitor/index.js
export default {
  name: "token-monitor",
  setup(ctx) {
    // Register hooks here
  },
};
Key Runtime Hooks
OpenCode’s plugin context (ctx) exposes several relevant hooks:
| Hook | What it does |
|---|---|
ctx.session.hook |
Subscribe to session lifecycle events |
ctx.tool.hook |
Intercept tool calls before/after execution |
ctx.aisdk.hook |
Hook into the AI SDK layer (model calls) |
ctx.event.subscribe |
Subscribe to the public server event stream |
The ctx.aisdk.hook is the gold mine for token monitoring — it gives you access to model request/response data including token counts.
Working Token Monitor Plugin
// token-monitor/index.js
const sessionData = new Map();

export default {
  name: "token-monitor",
  setup(ctx) {
    // Subscribe to session events
    ctx.session.hook("session_create", (data) => {
      sessionData.set(data.id, {
        startedAt: Date.now(),
        calls: 0,
      });
    });

    ctx.session.hook("session_end", (data) => {
      const session = sessionData.get(data.id);
      if (session) {
        console.log(
          JSON.stringify({
            agent: "opencode",
            sessionId: data.id,
            event: "session_end",
            totalCalls: session.calls,
            durationSeconds: (Date.now() - session.startedAt) / 1000,
          })
        );
        sessionData.delete(data.id);
      }
    });

    // Hook into AI SDK for model call data
    ctx.aisdk.hook("onFinish", (result) => {
      const sessionId = result.sessionId || "unknown";
      const session = sessionData.get(sessionId) || { calls: 0 };
      session.calls += 1;
      sessionData.set(sessionId, session);

      console.log(
        JSON.stringify({
          agent: "opencode",
          sessionId,
          model: result.model,
          usage: result.usage, // { prompt_tokens, completion_tokens, total_tokens }
          durationMs: result.durationMs,
          finishReason: result.finishReason,
        })
      );
    });
  },
};
Installation
Add to your OpenCode config (opencode.json):
{
  "plugins": {
    "entries": {
      "token-monitor": {
        "enabled": true,
        "path": "./plugins/token-monitor"
      }
    }
  }
}
Or install from npm:
npm install -g opencode-baseline-hooksThe opencode-baseline-hooks package includes security validation, logging, and context monitoring out of the box — worth checking before rolling your own.
OpenCode’s advantage: The ctx.aisdk.hook gives you direct access to the AI SDK’s onFinish callback, which includes usage objects with prompt_tokens, completion_tokens, and total_tokens. This is the most direct path to per-call token data.
OpenCode’s limitation: The plugin API is still evolving. ctx.event.subscribe currently exposes a public event stream, but the schema for token-specific events isn’t as well-documented as OpenClaw’s or Pi’s. You may need to inspect the source to find all available fields.
Claude Code
Claude Code has the most active hooks ecosystem right now — and for good reason. It uses shell scripts like Copilot CLI, but with a much richer event model: per-session, per-turn, and per-tool-call hooks, plus decision control (approve/deny/block) and even content rewriting.
Hook Types
Claude Code hooks fire at three cadences:
Once per session:
| Hook | When | Decision control |
|---|---|---|
SessionStart |
Session begins or resumes | Can inject additionalContext |
SessionEnd |
Session completes or terminates | Observation only |
Once per turn:
| Hook | When | Decision control |
|---|---|---|
UserPromptSubmit |
User submits a prompt | Can inject additionalContext |
Stop |
Main agent finishes responding | Can inject additionalContext or block |
StopFailure |
Agent stops due to error | Can block to retry |
On every tool call:
| Hook | When | Decision control |
|---|---|---|
PreToolUse |
Before tool execution | Can deny, defer, ask, allow, or rewrite tool_input |
PostToolUse |
After tool completes | Can rewrite tool_response or inject additionalContext |
PostToolUseFailure |
After tool fails | Observation only |
PostToolBatch |
After a batch of tool calls | Observation only |
Plus async events: Notification, ConfigChange, FileChanged, CwdChanged, SubagentStart/SubagentStop, PreCompact/PostCompact, and more.
Configuration
Hooks live in settings.json — either globally (~/.claude/settings.json) or per-project (.claude/settings.json):
{
  "hooks": {
    "PreToolUse": [
      {
        "matcher": "Bash",
        "hooks": [
          {
            "type": "command",
            "command": ".claude/hooks/log-tool-use.sh"
          }
        ]
      }
    ],
    "Stop": [
      {
        "matcher": "",
        "hooks": [
          {
            "type": "command",
            "command": ".claude/hooks/cost-tracker.sh"
          }
        ]
      }
    ]
  }
}
Each hook has a matcher (tool name regex for tool events, empty string for all), a type (command, prompt, agent, http, or mcp_tool), and the command/prompt/URL to run.
Hook Input
Hooks receive JSON on stdin. A PreToolUse event looks like:
{
  "session_id": "abc123",
  "prompt_id": "550e8400-e29b-41d4-a716-446655440000",
  "transcript_path": "/home/user/.claude/projects/.../transcript.jsonl",
  "cwd": "/home/user/my-project",
  "permission_mode": "default",
  "hook_event_name": "PreToolUse",
  "tool_name": "Bash",
  "tool_input": {
    "command": "npm test",
    "description": "Run test suite"
  },
  "tool_use_id": "toolu_01ABC123..."
}
A PostToolUse event adds tool_response with the tool’s result.
Hook Output and Decision Control
Hooks communicate back through exit codes and JSON on stdout:
- Exit 0 with no output → pass through (no decision)
- Exit 0 with JSON → provide decision/context
- Exit 2 → block/deny the action
For PreToolUse, you can deny, allow, defer, or ask:
{
  "hookSpecificOutput": {
    "hookEventName": "PreToolUse",
    "permissionDecision": "deny",
    "permissionDecisionReason": "Destructive command blocked by hook"
  }
}
For Stop and other events, you can inject additionalContext (up to 10,000 characters) or return "decision": "block".
The Token Monitoring Gap
Here’s the catch: Claude Code hooks don’t include token counts in their payloads. Unlike OpenClaw’s model_call_ended or Pi’s model_call_ended, the Stop hook doesn’t receive input_tokens, output_tokens, or cost data.
But Claude Code does write full session transcripts to transcript_path — JSONL files that include usage objects with token counts per turn. You can parse these in your hooks.
Working Token Monitor
Two scripts: one logs every tool call, the other parses the transcript for token totals on session end.
.claude/hooks/log-tool-use.sh (PreToolUse hook):
#!/usr/bin/env bash
set -euo pipefail

INPUT=$(cat)
TOOL=$(echo "$INPUT" | jq -r '.tool_name // "unknown"')
SESSION=$(echo "$INPUT" | jq -r '.session_id // "unknown"')
TIMESTAMP=$(date -u +%Y-%m-%dT%H:%M:%SZ)

echo "{\"agent\":\"claude-code\",\"event\":\"PreToolUse\",\"tool\":\"$TOOL\",\"session\":\"$SESSION\",\"ts\":\"$TIMESTAMP\"}" >> ~/.claude-logs/token-usage.log

# Exit 0 with no decision → pass through
exit 0
.claude/hooks/cost-tracker.sh (Stop hook):
#!/usr/bin/env bash
set -euo pipefail

INPUT=$(cat)
SESSION=$(echo "$INPUT" | jq -r '.session_id // "unknown"')
TRANSCRIPT=$(echo "$INPUT" | jq -r '.transcript_path // ""')
TIMESTAMP=$(date -u +%Y-%m-%dT%H:%M:%SZ)

# Parse the transcript for usage data
if [ -n "$TRANSCRIPT" ] && [ -f "$TRANSCRIPT" ]; then
  INPUT_TOKENS=$(jq -s '[.[].message.usage.input_tokens // 0] | add' "$TRANSCRIPT" 2>/dev/null || echo "0")
  OUTPUT_TOKENS=$(jq -s '[.[].message.usage.output_tokens // 0] | add' "$TRANSCRIPT" 2>/dev/null || echo "0")
  CACHE_READ=$(jq -s '[.[].message.usage.cache_read_input_tokens // 0] | add' "$TRANSCRIPT" 2>/dev/null || echo "0")
else
  INPUT_TOKENS=0
  OUTPUT_TOKENS=0
  CACHE_READ=0
fi

echo "{\"agent\":\"claude-code\",\"event\":\"session_end\",\"session\":\"$SESSION\",\"input_tokens\":$INPUT_TOKENS,\"output_tokens\":$OUTPUT_TOKENS,\"cache_read\":$CACHE_READ,\"ts\":\"$TIMESTAMP\"}" >> ~/.claude-logs/token-usage.log

exit 0
Configuration (in ~/.claude/settings.json or .claude/settings.json):
{
  "hooks": {
    "PreToolUse": [
      {
        "matcher": "",
        "hooks": [
          {
            "type": "command",
            "command": ".claude/hooks/log-tool-use.sh"
          }
        ]
      }
    ],
    "Stop": [
      {
        "matcher": "",
        "hooks": [
          {
            "type": "command",
            "command": ".claude/hooks/cost-tracker.sh"
          }
        ]
      }
    ]
  }
}
Alternative: HTTP Hooks
Claude Code also supports http type hooks that POST JSON to a URL — perfect for piping data into an observability stack:
{
  "hooks": {
    "Stop": [
      {
        "matcher": "",
        "hooks": [
          {
            "type": "http",
            "url": "http://localhost:9567/claude-code",
            "headers": {
              "Authorization": "Bearer $MY_HOOK_SECRET"
            },
            "allowedEnvVars": ["MY_HOOK_SECRET"]
          }
        ]
      }
    ]
  }
}
This sends the full Stop event payload as a POST request to your metrics server — no shell script needed.
Third-Party Tools
The Claude Code ecosystem has some established monitoring tools worth knowing about:
- ccusage — parses local session logs and calculates per-session costs. No API keys needed. One command.
- tokenwarden — token-saving hooks that block verbose output, binary reads, and enforce subagent budgets.
- claude-warden — hooks that enforce token budgets and truncate large outputs.
- agent-cost-lens — tracks token usage, model usage, retries, latency, and estimated cost across agents.
Claude Code’s advantage: The richest hook lifecycle of any agent in this comparison. Per-tool decision control, content rewriting, HTTP hooks, and async events like ConfigChange and FileChanged go well beyond token monitoring. The PreToolUse hook can block dangerous commands before they execute — a security capability that only Copilot CLI also offers.
Claude Code’s limitation: No native token counts in hook payloads. You have to parse the transcript_path JSONL yourself, which is fragile across versions. This is the same gap that Copilot CLI has (issue #3686), and it’s the single biggest thing missing from both agents’ monitoring stories.
GitHub Copilot CLI
Copilot CLI takes the most ops-friendly approach: shell scripts, not code. Hooks are defined in .github/hooks/ as executables that receive JSON on stdin. No TypeScript, no SDK dependencies, no build step.
Hook Types
| Hook type | When it fires | Can approve/deny? |
|---|---|---|
sessionStart |
Session begins or resumes | No |
sessionEnd |
Session completes or is terminated | No |
userPromptSubmitted |
User submits a prompt | No |
preToolUse |
Before any tool execution | Yes — approve or deny |
postToolUse |
After a tool completes | No |
agentResponse |
Main agent finishes responding | No |
subagentStop |
Subagent completes | No |
errorOccurred |
An error occurs | No |
Hook Input Format
Each hook receives a JSON payload on stdin:
{
  "hookEvent": "postToolUse",
  "sessionId": "0857b672-...",
  "timestamp": 1780574797652,
  "cwd": "/path/to/project",
  "tool": {
    "name": "bash",
    "input": { "command": "rm -rf /tmp/build" },
    "output": "removed '/tmp/build'"
  }
}
The Token Monitoring Gap
Here’s the thing: Copilot CLI hooks don’t include token usage data yet. As of mid-2026, the hook payloads contain session IDs, tool names, and timestamps — but no usage field with token counts or cost estimates.
There’s an open issue (#3686) requesting exactly this. The proposed options are:
- Option A: Include
usagein hook input payloads (preferred) - Option B: Expose environment variables like
COPILOT_SESSION_TOKENS_INPUT - Option C: Expose an RPC port/token for on-demand queries
- Option D: Persist usage data in
events.jsonl
Until one of these lands, here’s what you can do:
Working Session-Level Monitor (Current Copilot CLI)
#!/usr/bin/env bash
# .github/hooks/sessionEnd

set -euo pipefail

# Read hook input
INPUT=$(cat)
SESSION_ID=$(echo "$INPUT" | jq -r '.sessionId // "unknown"')
TIMESTAMP=$(echo "$INPUT" | jq -r '.timestamp // empty')
CWD=$(echo "$INPUT" | jq -r '.cwd // "unknown"')

# Log session completion
echo "{\"agent\":\"copilot-cli\",\"event\":\"sessionEnd\",\"sessionId\":\"$SESSION_ID\",\"timestamp\":\"$TIMESTAMP\",\"cwd\":\"$CWD\"}" >> ~/.copilot-logs/token-usage.log

# Parse Copilot's events.jsonl for this session's token data
if [ -f "$CWD/.copilot/events.jsonl" ]; then
  TOTAL_INPUT=$(grep "$SESSION_ID" "$CWD/.copilot/events.jsonl" 2>/dev/null | \
    jq -s '[.[].usage.inputTokens // 0] | add' 2>/dev/null || echo "0")
  TOTAL_OUTPUT=$(grep "$SESSION_ID" "$CWD/.copilot/events.jsonl" 2>/dev/null | \
    jq -s '[.[].usage.outputTokens // 0] | add' 2>/dev/null || echo "0")

  echo "{\"agent\":\"copilot-cli\",\"sessionId\":\"$SESSION_ID\",\"inputTokens\":$TOTAL_INPUT,\"outputTokens\":$TOTAL_OUTPUT}" >> ~/.copilot-logs/token-usage.log
fi
Hook Registration
Create .github/hooks.json in your repo:
{
  "hooks": {
    "sessionStart": ".github/hooks/scripts/session-start.sh",
    "sessionEnd": ".github/hooks/scripts/session-end.sh",
    "preToolUse": ".github/hooks/scripts/tool-policy.sh",
    "postToolUse": ".github/hooks/scripts/tool-logger.sh"
  }
}
Each hook script must be executable (chmod +x). Copilot CLI runs them and reads the exit code: 0 = approve, 2 = deny.
Copilot CLI’s advantage: Shell scripts are ops-friendly. Security teams love them because they can audit hook scripts without understanding TypeScript. The preToolUse hook can approve or deny tool executions, making it the only one of the four agents that supports blocking dangerous commands by default.
Copilot CLI’s limitation: No native token data in hook payloads yet. You have to parse events.jsonl yourself, which is fragile and may break across versions. Star issue #3686 if you want this fixed.
Comparison
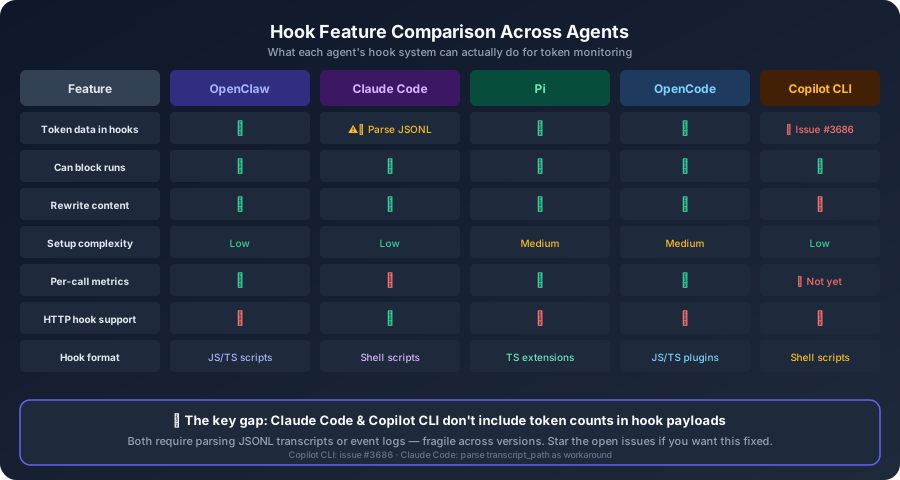
| Feature | OpenClaw | Claude Code | Pi | OpenCode | Copilot CLI |
|---|---|---|---|---|---|
| Hook format | JS/TS scripts | Shell scripts | TS extensions | JS/TS plugins | Shell scripts |
| Token data in hooks | ✅ model_call_ended, reply_payload_sending |
⚠️ Parse transcript JSONL | ✅ model_call_ended |
✅ ctx.aisdk.hook |
❌ Not yet (issue #3686) |
| Can block runs | ✅ Plugin hooks | ✅ PreToolUse can deny |
✅ Extensions can cancel | ✅ Transform hooks | ✅ preToolUse can deny |
| Can rewrite content | ✅ Plugin hooks | ✅ PreToolUse + PostToolUse |
✅ Extensions | ✅ Transform hooks | ❌ |
| Setup complexity | Low (drop-in) | Low (shell scripts) | Medium (TS SDK) | Medium (plugin system) | Low (shell scripts) |
| Session-level totals | ✅ agent_end |
⚠️ Parse transcript | ✅ session_end |
✅ Session hooks | ⚠️ Parse events.jsonl |
| Per-call metrics | ✅ contextTokenBudget |
❌ | ✅ Duration, outcome | ✅ usage object |
❌ Not yet |
| Cost estimation | ✅ /usage full + usageState |
Via ccusage or transcript | Via extensions | Via AI SDK | Via subscription dashboard |
| HTTP hook support | ❌ | ✅ Built-in http type |
❌ | ❌ | ❌ |
| Desktop notifications | ✅ Via hooks | ✅ Via shell scripts | ✅ Via extensions | ✅ Via plugins | ✅ Via shell scripts |
Cross-Agent Token Dashboard
If you use multiple agents (and let’s be honest, many of us do), you can normalize all their logs into a single format:
{
  "agent": "openclaw|pi|opencode|copilot-cli",
  "sessionId": "...",
  "event": "model_call_ended|session_end",
  "provider": "anthropic|openai|...",
  "model": "claude-opus-4-6|gpt-4o|...",
  "inputTokens": 45000,
  "outputTokens": 4461,
  "durationMs": 3200,
  "timestamp": 1780574797652
}
Then pipe them all into the same log file or observability pipeline:
# Unified tail across all agents
tail -f ~/.openclaw/logs/token-usage.log \
       ~/.claude-logs/token-usage.log \
       ~/.pi-logs/token-usage.log \
       ~/.opencode/logs/token-usage.log \
       ~/.copilot-logs/token-usage.log | jq -c '{agent, event, model, input: .inputTokens, output: .outputTokens, duration: .durationMs}'
Best Practices (All Agents)
-
Start with per-call hooks —
model_call_ended(OpenClaw/Pi),onFinish(OpenCode), orPostToolUse(Claude Code) give you the most reliable usage data. Session-level hooks are for summaries. -
Don’t block the event loop — keep hook handlers fast. Offload heavy work (HTTP calls, complex aggregation) to background processes. OpenClaw explicitly warns about this; the others will thank you too.
-
Log JSON lines — structured logs are easy to parse with
jq, ship to observability platforms, and replay for analysis. Pick a schema and stick with it across agents. -
Combine with built-in commands — hooks give you programmatic access.
/status(OpenClaw),/cost(Pi), orCtrl+R→ “usage” (Copilot CLI) give you human-readable snapshots. Use both. -
Set budget thresholds — whether you use env vars (OpenClaw), extension config (Pi), plugin options (OpenCode), or shell conditionals (Copilot CLI), alert before you hit the limit, not after.
-
Test discovery first —
openclaw hooks list,pi --extension,opencode plugin list, orls .github/hooks/— verify your hook is found before debugging why it’s not firing.
The Big Picture
Hooks give you a real-time event stream from your coding agent. Token monitoring is the obvious use case, but the same pattern works for:
- Cost attribution — tag every model call with a project or team
- Anomaly detection — alert on unusual call patterns or spikes
- Audit trails — log every tool call, every model response, every session change
- Policy enforcement — block dangerous commands (Copilot CLI’s
preToolUse) or budget-exceeding runs (OpenClaw’sbefore_agent_run) - Compliance — enforce which models can be used for which data
The event pipeline is there in every major agent now. The data is flowing. You just need to plug in — and with any of these four agents, you can start today.
References: OpenClaw hooks docs · OpenClaw plugin hooks · Claude Code hooks reference · Claude Code hooks guide · Claude Code costs · Pi extensions · OpenCode plugins · Copilot CLI hooks · Copilot CLI cost data issue #3686